


China leads the world in infrastructure investment. The new roads, new railroads, new skyscrapers, even whole new cities that seem to spring into existence every day leave little doubt that investment has been ambitious. But has it been wise? This infographic and the statement that preceds it were created by Youyou Zhou for CNPolitics and translated here by Tea Leaf Nation’s David Wertime.
* * *
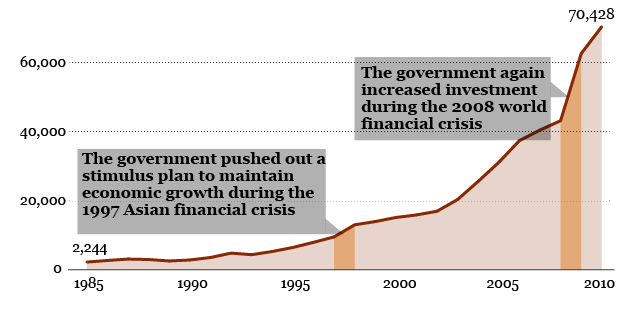
The Chinese government has put a great deal of resources into infrastructure investment. Major investments were made in rail, highway, and other infrastructure projects during the 2008 global financial crisis. However, with the expanding risks of local debt, how efficient has Chinese infrastructure investment been? How much has it contributed to economic growth? What financial risks has it entailed?
The Shanghai Institute for Finance and Law has conducted a series of studies on urbanization and the risks of local debt. Assistant researcher Huang Shaoqing of Antai College of Economics and Management at Shanghai Jiaotong University has pursued the subtopic Infrastructure Investment: Funding Sources, Investment Efficiency and Local Finance Risks in an effort to answer the above questions. The graphics below show some of his findings.
How Much Money Has Been Invested?
(In 100 million RMB at 2011 values)
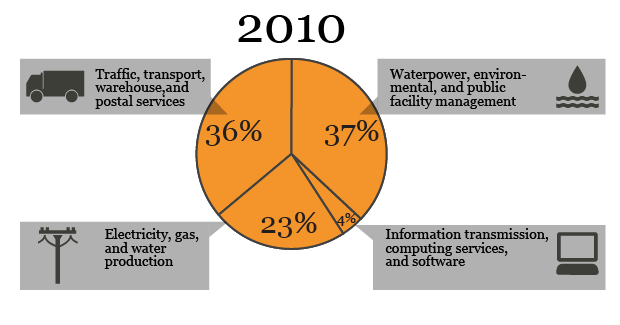
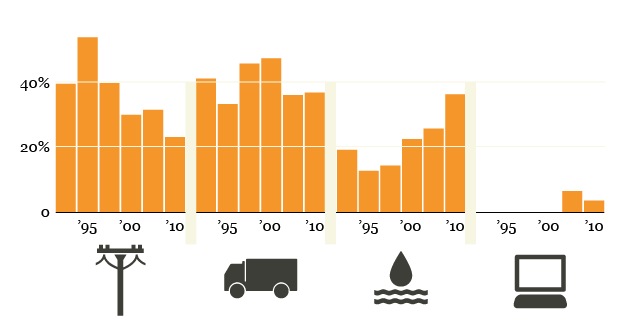
What Has Been Invested?
(By percentage)
The National Bureau of Statistics of China divides productive infrastructure into four types; below are the percentages up to and including 2010.
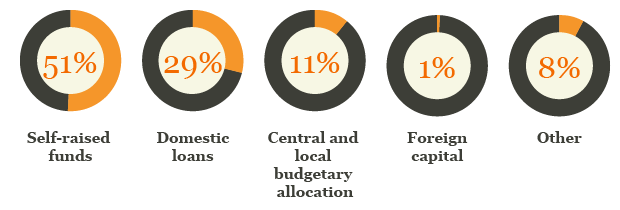
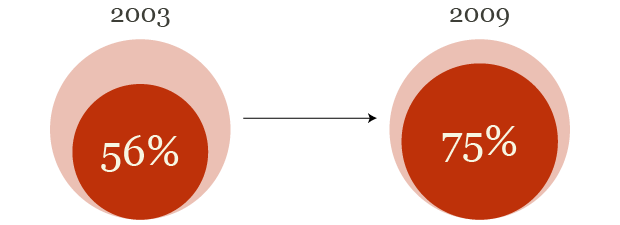
Where Has the Money Come From?
Beginning with Reform and Opening, the sources of Chinese infrastructure investment have become more diverse every day. Starting with 2003, self-raised funds have continuously comprised more than half of all investment sources.
Proportion of Infrastructure Investment in Local Spending
NB: Infrastructure investment is not completely contained in local spending.
Has the Investment Been Efficient?
Infrastructure capital and productive capital can be substituted for one another; for this reason, [we can] use a marginal productivity ratio between the former and the latter to determine whether infrastructure investment has been efficient. A ratio of 1 is efficient; a ratio above 1 shows an infrastructure shortage, while a ratio below 1 shows that further infrastructure investment will not be efficient.
The below graphics shows that by 2008, China no longer had a serious overall problem with insufficient infrastructure, and even had an excess of infrastructure in undeveloped areas. Therefore, the 4 trillion RMB (about US$650 billion) the government spent on stimulus in 2009, with infrastructure as its main investment, was economically inefficient.
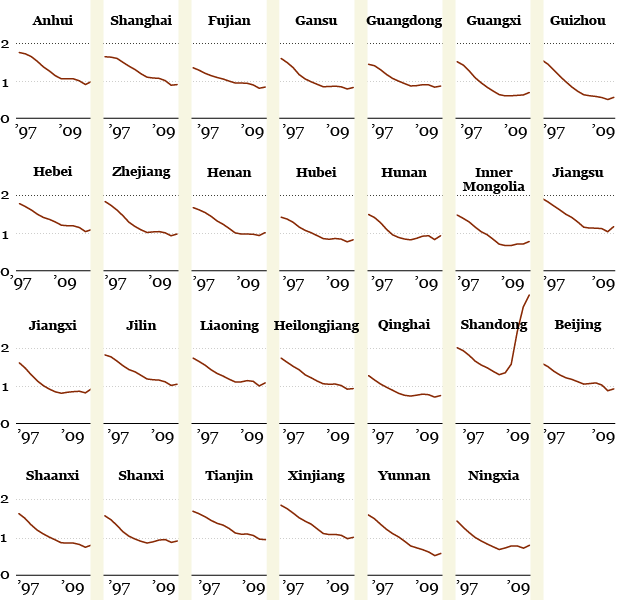
NB: Sichuan, Chongqing, Hainan, and Tibet have been excluded from this sample due to incomplete data.
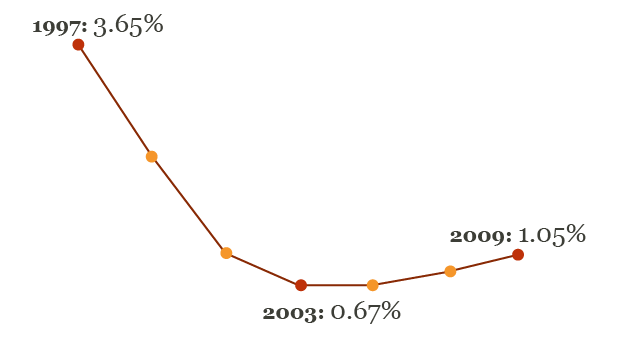
GDP (Gross Domestic Product) Losses Due to Misallocated Investment
If the infrastructure and productive facilities were optimally configured, then GDP would be higher than its actual value; if there were investment misallocation, then it would lead to a corresponding loss in GDP. As the below graphic shows, due to the continuous increase in infrastructure investment over recent years, infrastructure investment has gone from being insufficient given productive facilities in 1997, to sufficient, even excessive. The percentage of GDP lost due to investment misallocation has shrunk, then grown again.
Local Investment Risk Resulting From Infrastructure Investment
Calculating the ratio between the present value of increased accumulated tax receipts and additional infrastructure investment yields an estimate of the financial risks resulting from infrastructure investment. Estimates of the financial risks for each province from 2009 to 2039 are shown below. A ratio larger than 1 means gains from infrastructure investment exceed costs, and financial risk does not exist; the reverse shows some degree of financial risk.
The five provinces with financial risk have been highlighted.
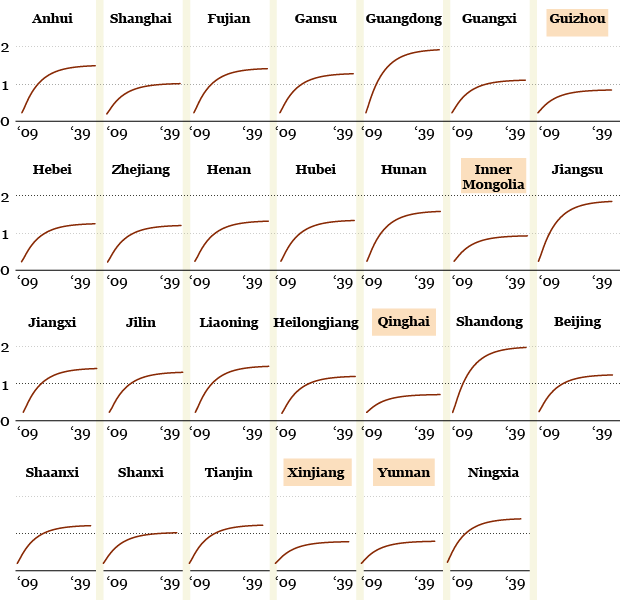
NB: Sichuan, Chongqing, Hainan, and Tibet have been excluded from this sample due to incomplete data.
Data sources and research methods: Shanghai Institute for Finance and Law’s urbanization and the risks of local debt project: Infrastructure Investment: Funding Sources, Investment Efficiency and Local Finance Risks.